June 2024 I Volume 45, Issue 2
Statistical Review of the Cyber Test Process
June 2024
Volume 45 I Issue 2
IN THIS JOURNAL:
- Issue at a Glance
- Chairman’s Message
Conversations with Experts
- A T&E Career of Learning by Doing: A Conversation with Mr. Edward R Greer
- Memories from a Career in Army T&E: A Conversation with Mr. Russell L (Rusty) Roberts
Values in T&E
- My T&E Career, The First 25 Years
- The Architecture Analogy in Test Planning: An example of the T&E value of 'Well-Planned'
- Values in Operational Testing
Technical Articles
- Digital Test and Evaluation
- Statistical Review of the Cyber Test Process
- The Robust Classical MTBF Test
Workforce of the Future
- Deep Learning for Autonomous Vehicles
- The K-D Tree as an Acceleration Structure in Dynamic, Three-Dimensional Ionospheric Modeling
- Optimization Engine to Enable Edge Deployment of Deep Learning Models
News
- Association News
- Chapter News
- Corporate Member News
![]()
A Statistical Review of the Cyber Test Process

Patrick Lardieri
Senior Fellow at Lockheed Martin Rotary and Mission Systems
![]()

David Harrison
Associate Fellow at Lockheed Martin Space
Certified Test and Evaluation Professional
![]()

Michael Hankins
Lockheed Martin Fellow Specializing Space Cybersecurity
![]()
Sharif Hassan, PhD
Senior Manager and founding member of the Lockheed Martin Red Team
![]()
Govindra Ganesh
Associate Fellow on the Lockheed Martin Red Team
![]()
Abstract
The variability of cyber threats along with multiple cyber testing practices distracts teams from applying classical statistical measurements of test power and coverage to describe test effectiveness. In most cases, cyber test teams continue to test until reaching funding or schedule limits. This article explores the traditional measurements of test coverage and test power to propose multiple metrics for cyber test efficiency. The metrics are then applied to data collected on recent Defense Department programs. Original findings include feedback on cyber table top efforts, the use of linear approximation in predicting an optimum duration for penetration testing, predicting the length of time at the range by the number of machines in test, and the optimization of test teams between 9 and 14 testers. These findings greatly assist in what Scientific Test and Analysis Techniques (STAT) were designed to do: help anyone involved (customers, management, and the test team) understand, and agree upon, test risk, coverage, and decisions.
Keywords: Cyber Testing, Scientific Test and Analysis Techniques, Test Risk, Cyber Test Efficiency
Introduction
In this paper we propose metrics to help predict a sufficient level of cyber testing to achieve a particular survivability risk level. Statistically, these terms are known as test coverage and test power, but the ongoing development of cyber threats requires some adjustment to the standard applications of statistical theories.
Defense, civilian government, and infrastructure systems face a variety of threats to their safe and effective operation: weather and acts of nature, failures from stress, fatigue, and poor maintenance. Statistical methods in the field of systems engineering and reliability, along with developmental and operational testing, all work to minimize these risks.
Over the past decade cyber threats have joined the list of system failure modes through abuse or misuse cases (NPR, 2024). Multiple cyber test processes have been developed to mitigate these threats (Table 1). It is important to note that cyber testing practices have matured to the point (in 2024) where common test analyses such as measurement system accuracy, coverage, and test power are almost required to help push cyber testing to be more effective and efficient. The community needs data on their processes and the analysis of that data to drive efficiencies past their current levels.
The past decade led to the establishment of common cyber test practices such as compliance testing, cyber table tops, penetration testing, fuzz testing, and static and dynamic code analysis which generates a solid foundation to begin to apply statistical test methods (Table 1). Much of the recent work has been in making automobiles more resistant to cyber attacks (Zhang, 2024) as well as new processes for testing including Requirements-based testing (Luo, 2022) and Mission-based testing (Kim, 2024).
Lockheed Martin used initial cyber test experiences from multiple defense department programs to form empirical cyber resilience measurement frameworks and capabilities including the Cyber Resiliency Level® (CRL®) framework (Beyer, 2023) and Cyber Resiliency Scoreboard® (CRS®) (Hankins and Johnson 2023). While these measurement frameworks realize improvements in the cyber process overall, knowing when to stop a particular test campaign is outside their scope.
Just as importantly, the metrics in this paper are designed so program managers and system operators can effectively communicate what level of security additional testing will generate. Teams that understand, “The bang for the buck,” know when to invest in additional testing and when a system can be deemed secure; however, there needs to be more scientific methods to make this Pareto judgement easier and more consistent.
Without a standard method for communicating system risks, cyber testing often follows the software test adage, “Testing is complete when either the time or funding runs out.” This common approach has led to poorly understood risk in a system’s survivability resulting in multiple serious attacks but also leaves all parties unsatisfied, with customers not knowing what they have purchased and contractors not able to measure success.
While applying the proposed metrics in this paper, additional cyber test rules-of-thumb were found including mission length prediction methods and an analysis of test team size. In the end, applying one or more of these metrics can help programs better communicate cyber test efficiency and effectiveness.
Cyber Test Process Overview
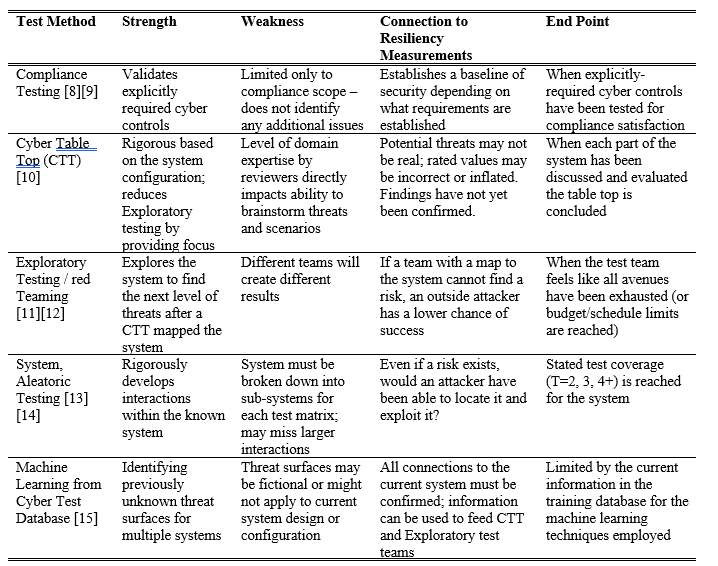
The four top methods for cyber testing include compliance testing, cyber table tops, exploratory testing / red teaming, and aleatory/combinatorial testing (Caron, 2021). The reason cyber testing includes multiple methods is that each effort has strengths and weaknesses (Table 1).
Table 1. Overview of common cyber testing methods, their advantages, results, and a description of when the testing is generally considered complete.
Scientific Test and Analysis Techniques (STAT) Overview
Scientific Test and Analysis Techniques focus on providing test coverage and power measurements for complex experiments and system evaluations. Processes exist for software (combinatorial) and hardware (Design of Experiments) and have even been applied to predictive modeling (Uncertainty Quantification) (Department of Operational Test and Evaulation, 2023). In the past, Cyber-STAT efforts have applied reliability methods like mean-time-between-failures and availability to indicate system performance (McLean, 2018).
A major advantage of an effective STAT program is that the engineering team knows better when the testing is complete, and the customer, management, and finance teams know what assurance rigor they purchased. Since the process is based on the measurable ideals of test coverage and test power (versus checking off requirements one-by-one) confidence in the test design is high and the risk levels are measured. Everyone in the room agrees to the level of risk leaving the main discussion of if that level is adequate.
Test coverage is the ability of the test to develop interactions between system states. A test where all combinations are tested is a full factorial design while a resolution 3 design efficiently covers the state-space with fewer runs. In software, a test that includes all 2-way interactions is labeled, “T=2,” and all 3-way interactions, “T=3.” Per NIST (NIST 2023), T=6 is generally considered the furthest testing needed for any software with levels 2 through 4 being common. The key in both examples is that the risk level is assessable and can be cost estimated.
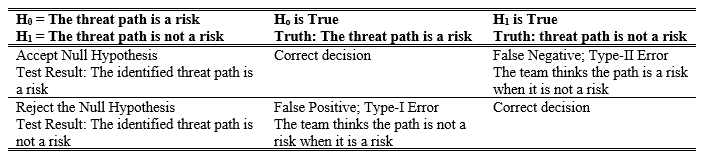
Test power indicates the accepted risk for Type-I (false positive, alpha) and Type-II (false negative, beta) errors. For cyber, an identified threat vector is treated at the highest risk level until proven otherwise, so the statistical null hypothesis is that a recognized threat vector is a current risk. The alternative hypothesis is that the threat path is not a risk.
Accepting the null hypothesis when it is actually false (false negative) and not indicating a risk when it is a risk (false positive) are the two possible test errors. For cyber testing, the false positive generally holds the largest program risk because it leaves a system vulnerable which was erroneously considered secure.
Table 2. Statistical hypothesis table for cyber testing of a threat path
From the management perspective, test coverage and test power provide clear communication of risk, budget, and schedule within the program and to the customers. Stating test coverage values in a proposal, test plan, or results document clearly explains the stance of the program (NIST 2023). For example, tests labeled T=3 are more expensive than T=2, but provide a higher level of risk understanding and risk reduction for a calculatable number of test cases.
Measuring test power such as alpha (false positive, generally accepted as a 5% risk) and beta (false negative, generally accepted as a 5% to 20% risk) also gives a clear communication of the risk level and overall test costs for the current test design. Just like in classical STAT applications for hardware, the critical outcome is that everyone knows, “The bang for the buck,” using metrics and calculations that accurately and effectively help manage a program.
Another key aspect of test measurement system design is the accuracy ratio. Using a thermocouple with an accuracy of +/-1.5°C to measure a requirement of +/-0.5°C requires multiple readings from multiple systems to avoid type-I (false positive) and type-II (false negative) errors. Good measurement system design uses a 5:1 or 10:1 measurement system accuracy-to-requirement ratio to reduce test errors (ANSI 2010). This means that a system using a single thermocouple should only measure requirements from +/-7.5°C (5:1) to +/-15°C (10:1) to avoid type-I and type-II errors. This paper proposes accuracy requirements for each proposed cyber test metric.
Proposed Metrics
The goal of this article is to explore and discuss how a test team can accurately measure the test coverage and power for each aspect of a cyber test program. Since cyber testing generally includes multiple methods of testing, each portion of the test program must be considered when determining the overall test coverage and power.
A second goal of STAT techniques is to generate rigorous test design processes that provides feedback of thoroughness, accuracy, and program success. Processes are rigorous when, if the same requirements and system designs are presented to two different teams, they come up with similar test programs. In other words, the process relies more on tools and techniques as opposed to brainstorming and creativity. The metrics below weave together the standard cyber test methods into an overall review of test process performance for a team.
Test Power and Test Coverage for Compliance Testing
Compliance testing requires very little in advanced test techniques. A list of compliance goals is made and then checked off one-by-one. The nature of having cyber standards, such as NIST 800-53, help teams generate a high level of test coverage without starting from scratch for each program.
Test power comes from a team being thorough and accurate in their administration of the compliance testing. Using a data-based evaluation process helps everyone evaluate the results to their liking. Test coverage for completing a single cited standard would be 100%. Utilizing multiple standards would increase overall coverage.
Test Power and Test Coverage for Cyber Table Top Efforts
Cyber table top test power comes from the ability of each line item to correctly identify a threat vector to the system. All identified items should be evaluated at some level in later testing (exploratory or system testing) so the team will eventually be able to measure the CTT test power based on Equation 1.
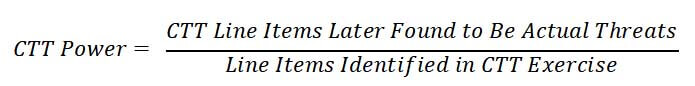
Equation 1. Proposed equation for cyber table top test power measurement / effectiveness rating.
In a physical test, the expected test power is unknown at the start but can be calculated and estimated using accepted techniques such as previous standard deviations (Barker, 2024). In the case of the cyber table top, the team will unfortunately not know the final power and coverage until after the test program has been completed (taillight metric). However, using similar cyber table top processes and teams within a program or company can generate a forward-facing metric for future efforts.
The accuracy of this measurement somewhat depends on the importance of the future threats. In a traditional Failure Modes and Effects Analysis (FMEA) on mechanical systems, all of the identified items are failure modes, but many are already addressed in the current design and only the mission-critical modes may be addressed and fully designed out of the system. It also goes against the brainstorming nature of the cyber table top to discount the metric when a ‘board-room-based’ threat is later proven to be negligible or impossible. The objective of a cyber table top is to identify as many potential threats as possible that can then be prioritized or addressed during future technical assessments or investigation. Depending on the domain knowledge and awareness of the cyber table top team, this metric may be as high as 100% for many cyber table top exercises.
The test coverage for a cyber table top can also be confirmed by later system and exploratory testing. Test coverage ideals can be used to generate a CTT effectiveness rating (Equation 2).
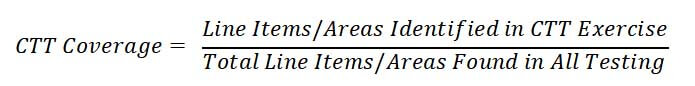
Equation 2. Proposed equation for cyber table top test coverage measurement / effectiveness rating.
To compare with systems engineering test efforts, anomaly teams called in to investigate an unexpected issue with a system often refer to the FMEA initially. If the failure mode was not addressed in the FMEA the company’s FMEA process needs improvement. If the error was listed in the FMEA, the team’s engineering process needs improvement.
The CTT Coverage measurement should be measured at the same level of detail for each value. CTT line items may be at a general level like, “That interface is potentially vulnerable,” while the final list of findings might list each individual aspect of the identified interface.
It is also possible that a line item in a cyber table top is not explored in later testing. If this is widespread (due to a limited test budget) then the CTT coverage value would be skewed and thus less useful. It is also possible that many of the cyber table top line items do not turn out to be a threat, potentially driving the numerator to be greater than the denominator (CTT Coverage over 100%).
Taking the time to generate the CTT power and coverage measurements at the end of a test cycle will help motivate future CTT teams for thoroughness while also pushing exploratory test teams to meticulously explore the CTT-identified threat vectors.
A good cyber table top should be able to find a majority of the threats, even for complex systems. The metric should also be able to correctly identify an improvement in a team’s performance. Ordinal statistical terms could be applied such as in Table 3.
Table 3. Notional ordinal titles for cyber table top teams using the CTT Coverage Measurement.
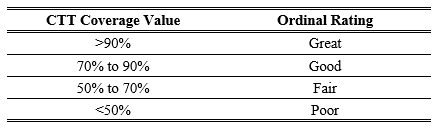
A scale such as this requires an accuracy of approximately +/-5% to accurately compare team performances. Over time, a control chart of percentages between programs would assess the continuity of performance. Of course, if the team accurately tracks the findings and compares them to the number of line items in the cyber table top, the result will be exact. But, in reality, threats are likely missed by both teams meaning the true coverage has some noise close to the +/-5% value.
Cyber Table top Use Cases
Beyond just the threat identification focus, there are a number of use cases for executing cyber table tops that benefit from accurate, high-fidelity cyber table top identification of potential threats and high CTT Power and CTT Coverage metrics.
Within Lockheed Martin, cyber table tops have been used to:
- Identify potential cyber threats/risks/mitigations on programs with or without strong cyber requirements
- Identify unintentional cyber side effects in design/processes
- Help satisfy Test and Evaluation/risk assessment requirements
- Derive additional cyber requirements for systems
- Inform cyber design decisions on internal development efforts
- Justify cyber resiliency growth investments by program stage
Finally, because the cyber table top is early in the process and sets the foundation for program success, it is important to measure and communicate the success of these teams. Good or bad, these proposed metrics provide a high level of feedback and retrospection to a team that is vital to program success.
Exploratory/Penetration Testing
The primary programmatic challenge in exploratory testing is knowing confidently when to stop. In our experience, a typical and thus somewhat arbitrary length of time (often in terms of weeks) is given to the team to confirm as much of the cyber-table-top-identified vectors and explore the overall system to find new pathways. Rarely does this estimated length of time adequately produce the right level of testing.
In this situation, the test power of an exploratory test team is 100%. If the red team can penetrate the system, the threat vector is confirmed; there is no risk that the threat is a false negative.
The test coverage of an exploratory test team can be predicted from the rate of finding new threat vectors. Found vectors unanimously increase the cyber resiliency of the system, but at what cost? With this angle or rate approach the coverage will never be 100% (theoretically, the team could continue testing and eventually find at least one more risk weeks later) but a finding-rate metric measures the risk of stopping early or the potential gains of funding another day of testing.
The importance of each finding (based on an assessment of likelihood and impact) must be addressed. Not all findings are equal and testing an extra day to find a legitimate threat with low importance may not be valuable to your program.
If the team has worked for a week (5 days) and found the following level of issues (Table 4), then the measured diminishing rate of return can be used to fund (or limit) additional testing per the Program’s risk requirements.
Table 4. Exploratory testing example data predicting the optimum rate of return for an additional test day.
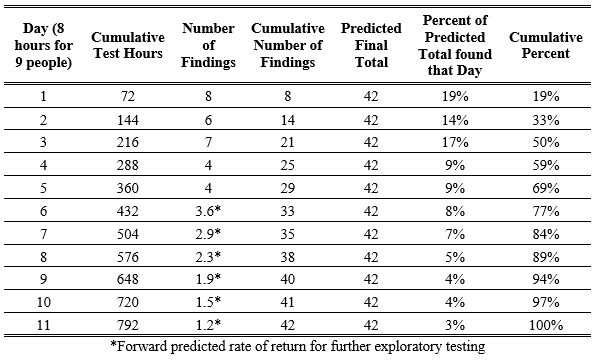
*Forward predicted rate of return for further exploratory testing
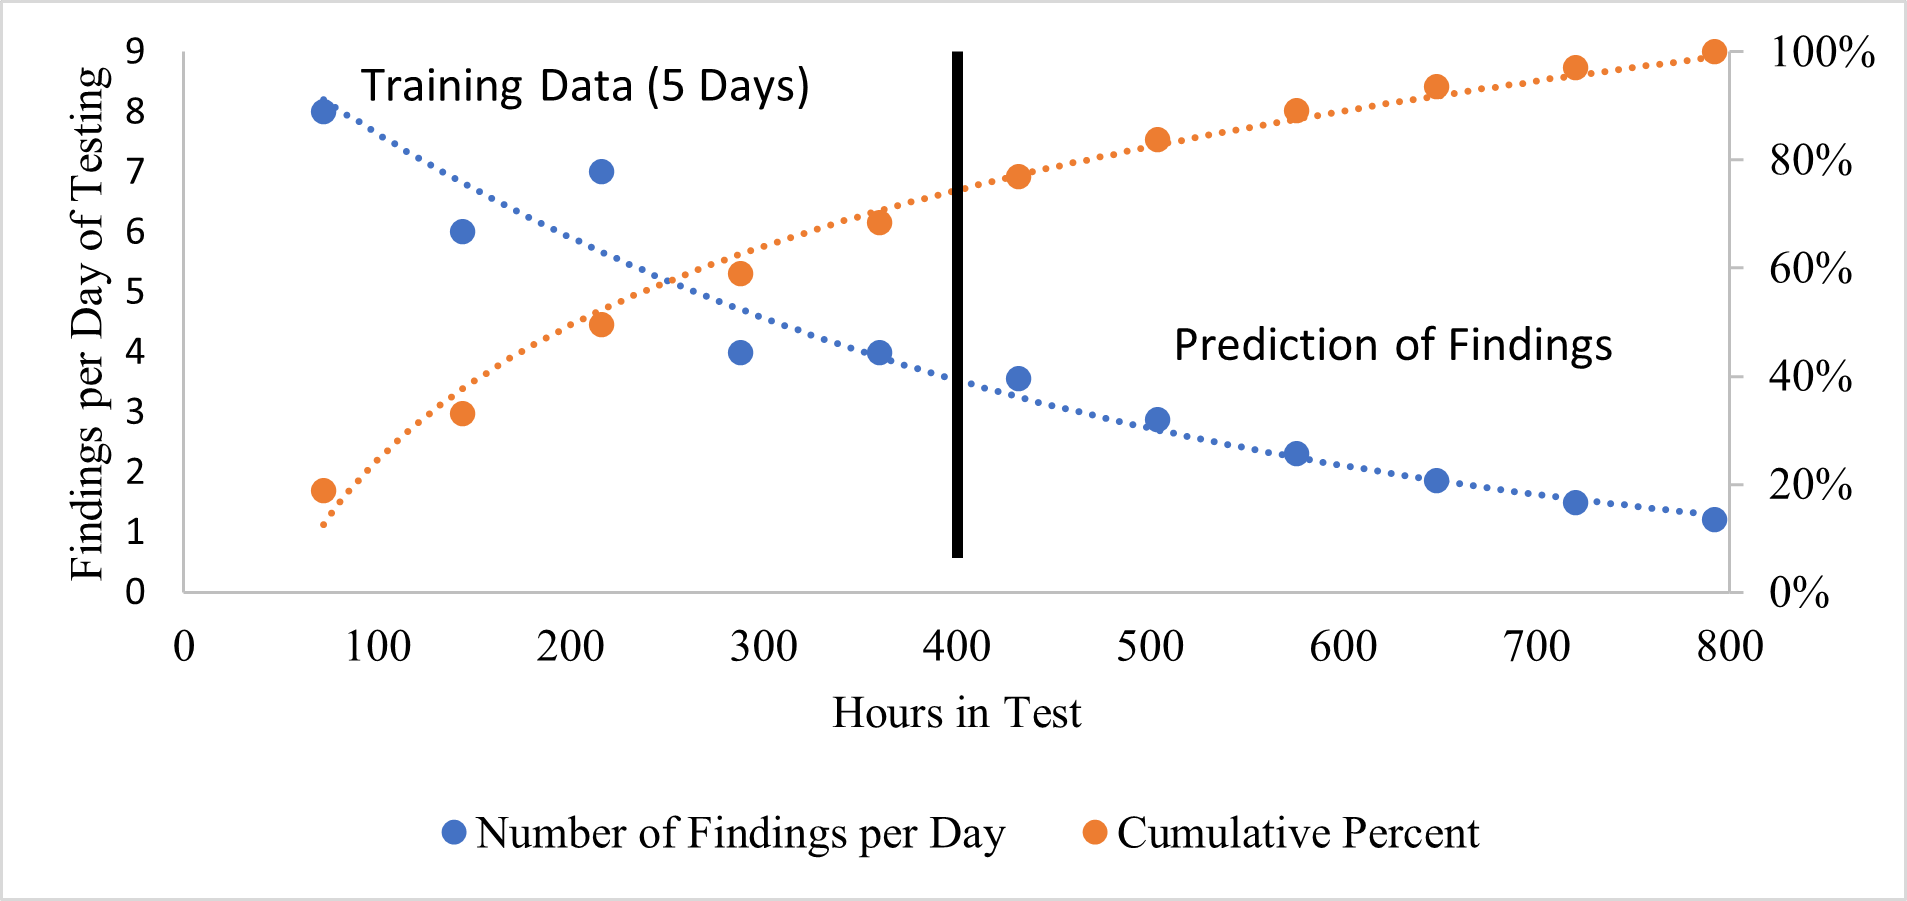
Figure 1. Predicted rate of return for further exploratory cyber test hours showing that 90% coverage will likely occur just before hour 600 (Day 9).
Exploratory test team finding rate is approximately an exponential function. Additional testing generally produces fewer and fewer findings. Measuring this rate, even if it is not as predictable as the example above, communicates a quantifiable risk and return data set for customers and management. A recommended test requirement would be, “The exploratory team will work until the 90% rate-of-return efficiency is reached as set by the first week of testing.”
Exploratory test teams regularly find critical risks later in the test program. While not perfect, this metric achieves the basic goal of providing both the engineering team and the customer a consistent measurement for communication of risk and cost.
Using a rate-of-return value is not new to STAT teams. Previous system test teams used a coverage chart similar to Figure 3 to highlight the development of Critical Domain Coverage (DC) (T=2, Single/Main Effects and Double Effects) as well as Triple and Quadruple combinations (Overall DC). When optimized, the curve flattens out and management can work with customers to manage risk by stopping at a specified level of coverage (Mackertich, et al. 2018) .
In the example below, the 90% level is at test 28 of 80 proposed tests. The rdExpert software used by Phadke Associates (http://phadkeassociates.com/; similar tools are available elsewhere) generates a curve which allows the team to identify which interactions were not tested and verify the exact risk to the overall system due to this test reduction. It is always preferred to complete the full test matrix but this example clearly shows that the return on investment reduces over time.
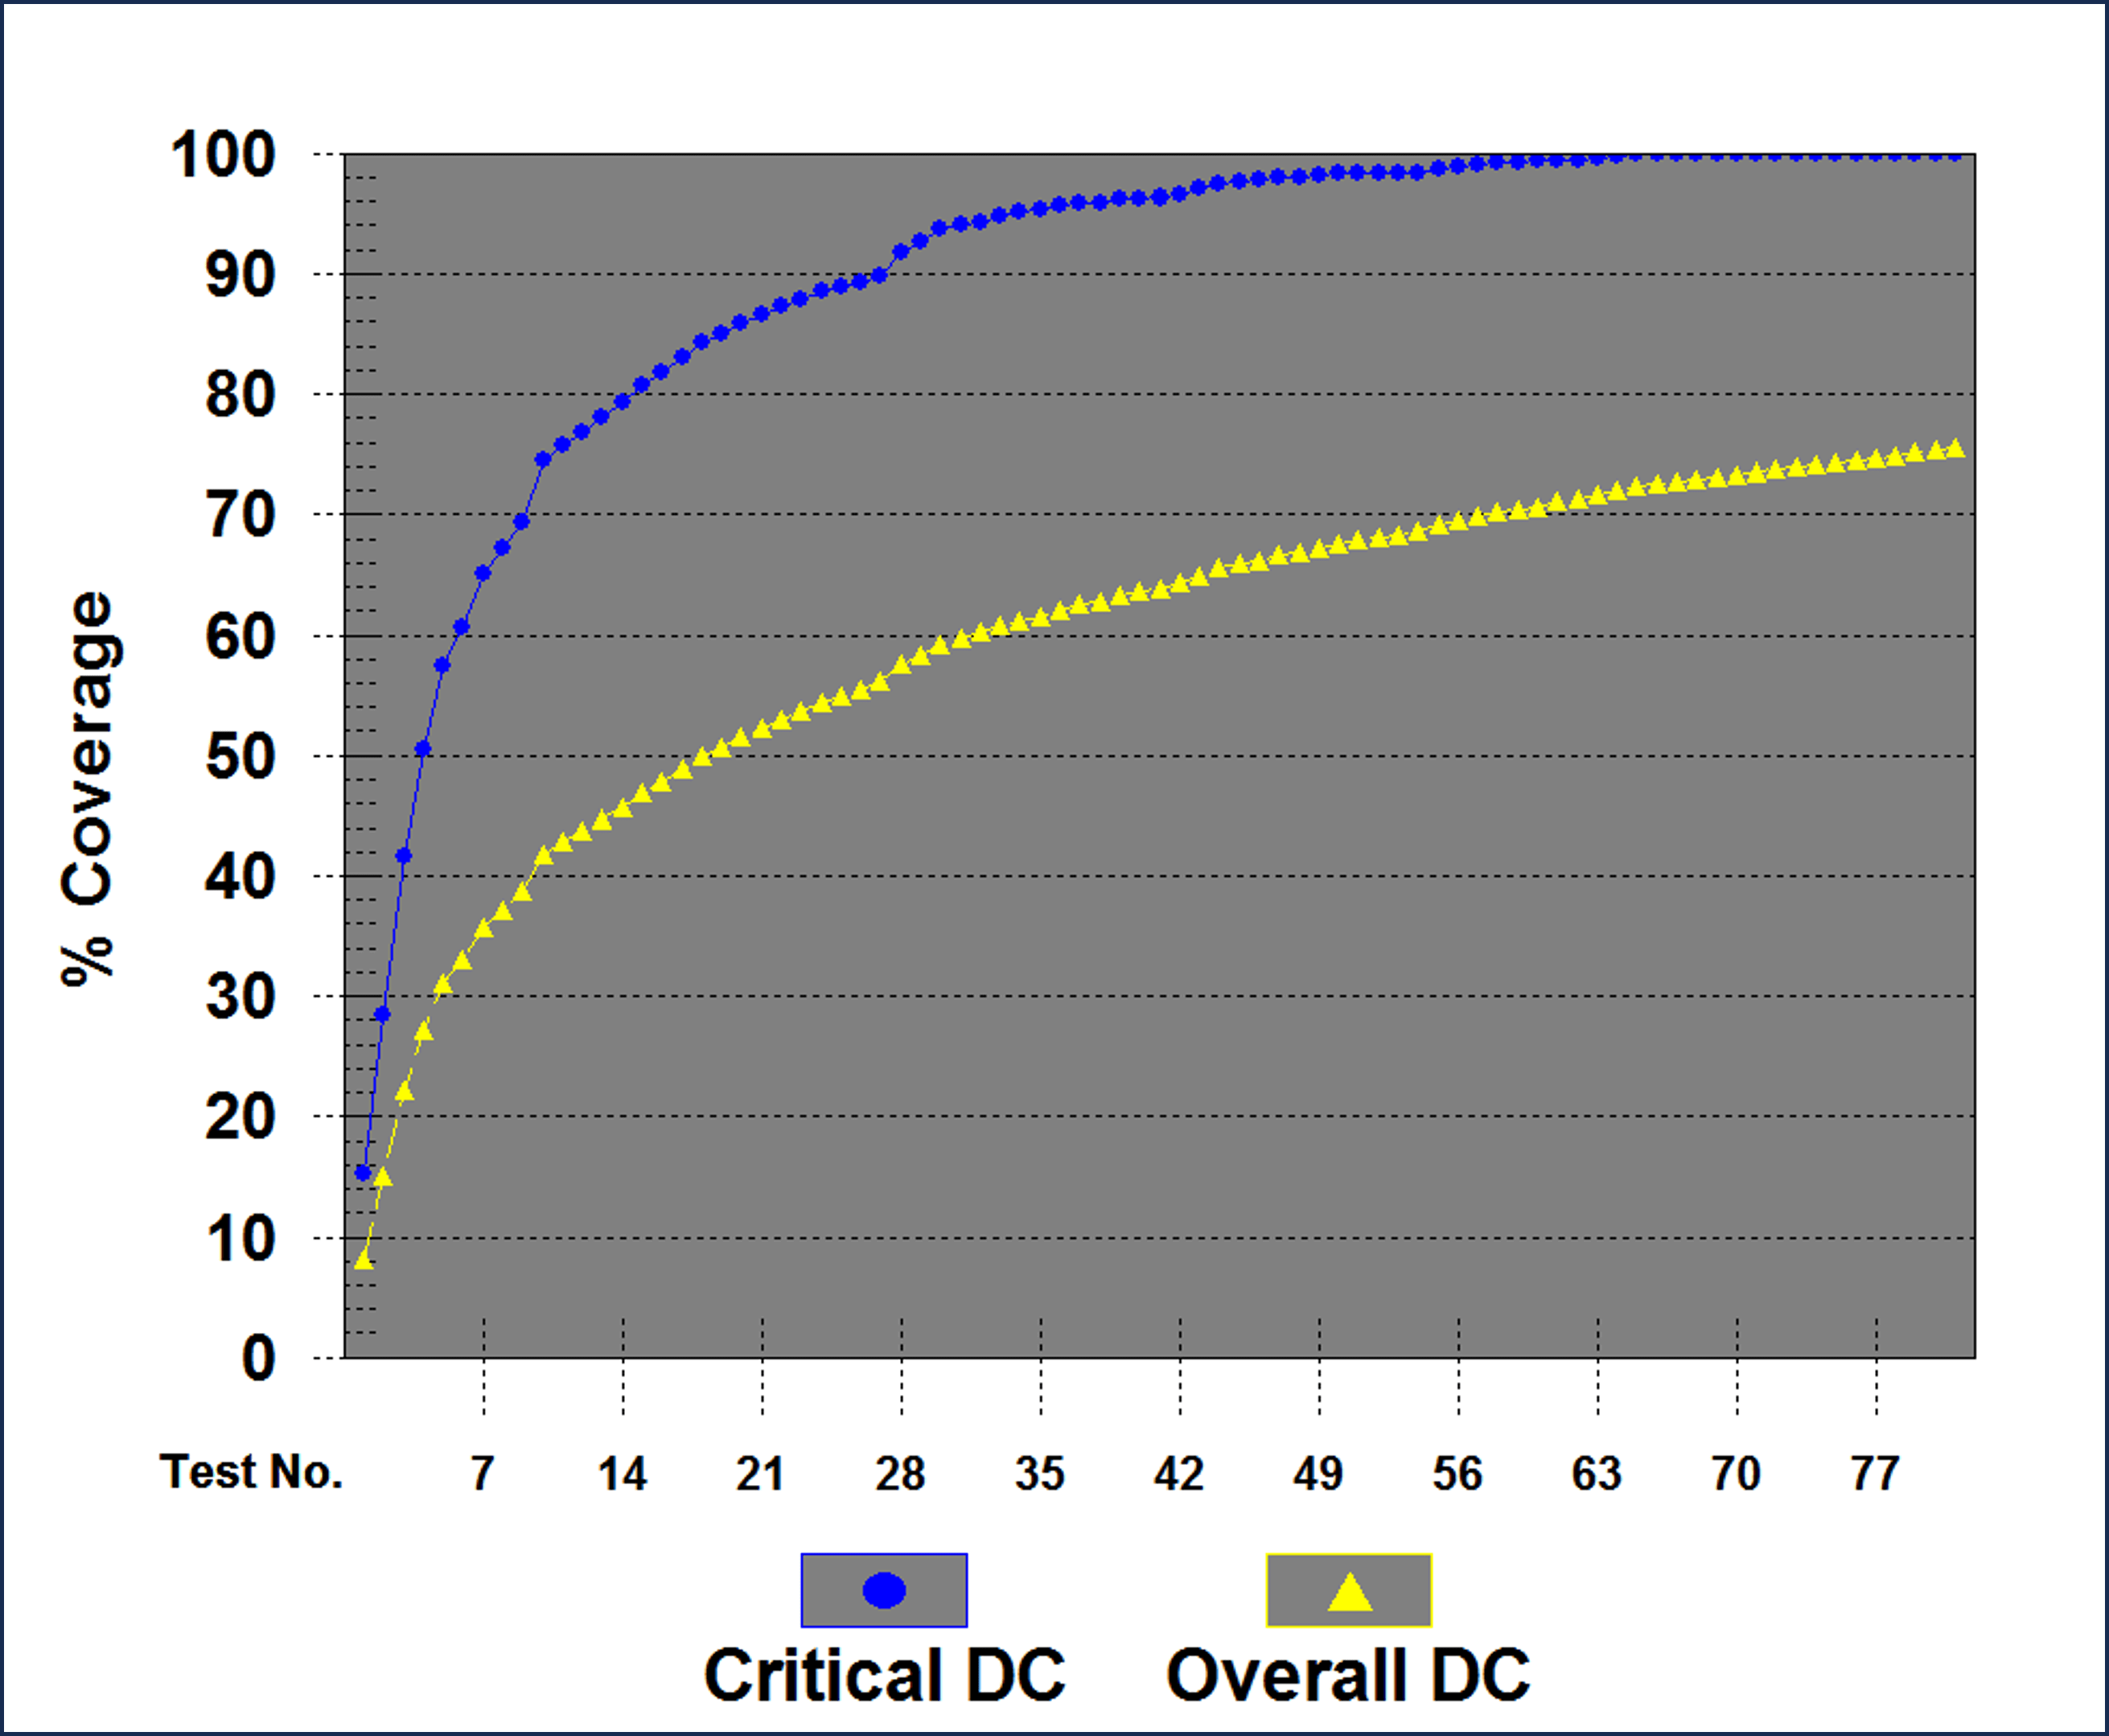
Figure 2. Coverage chart indicating the development of coverage throughout 80 tests. The 90% coverage of Critical Interactions (T=2) occurs at test 28. The last 52 tests serve to generate the last 10% of the T=2 coverage.
The team can confidently pick a goal (90% predicted coverage), start testing until a trend appears in the rate-of-return data, then keep testing until that goal is reached. Using predictive modeling helps a team accurately estimate an end date to testing that aligns with the specific risk level, and the model indicates a predicted overall test coverage, thus developing a high level of confidence that the correct amount of testing will be, and then was completed.
Aleatoric System Testing using Combinatorics
The reason to do cyber table tops and exploratory testing first is that they help define the worthwhile state space for combinatorial testing. At this point everyone on the team has enough experience with the system to understand the configuration, inputs, and performance details.
Combinatorial testing is well-known to STAT experts (NIST 2022). Similar to classical Design-of-Experiments (DOE), the process generates an optimum test matrix to meet specific test power and coverage values. For deterministic systems, the test power is 100% because the test is entirely repeatable with exactly the same results. The test coverage for a combinatorial test is generally defined upfront (T=2, T=3, etc.).
The issue for this process is translating cyber systems into factor tables that allow the use of tools to generate orthogonal or combinatorial arrays. The key is to think about system states and features and then list all of the options in the table. Figure 4 shows a simple situation for software configurations that is complicated by the fact that multiple software versions from each group can be installed on the same system.
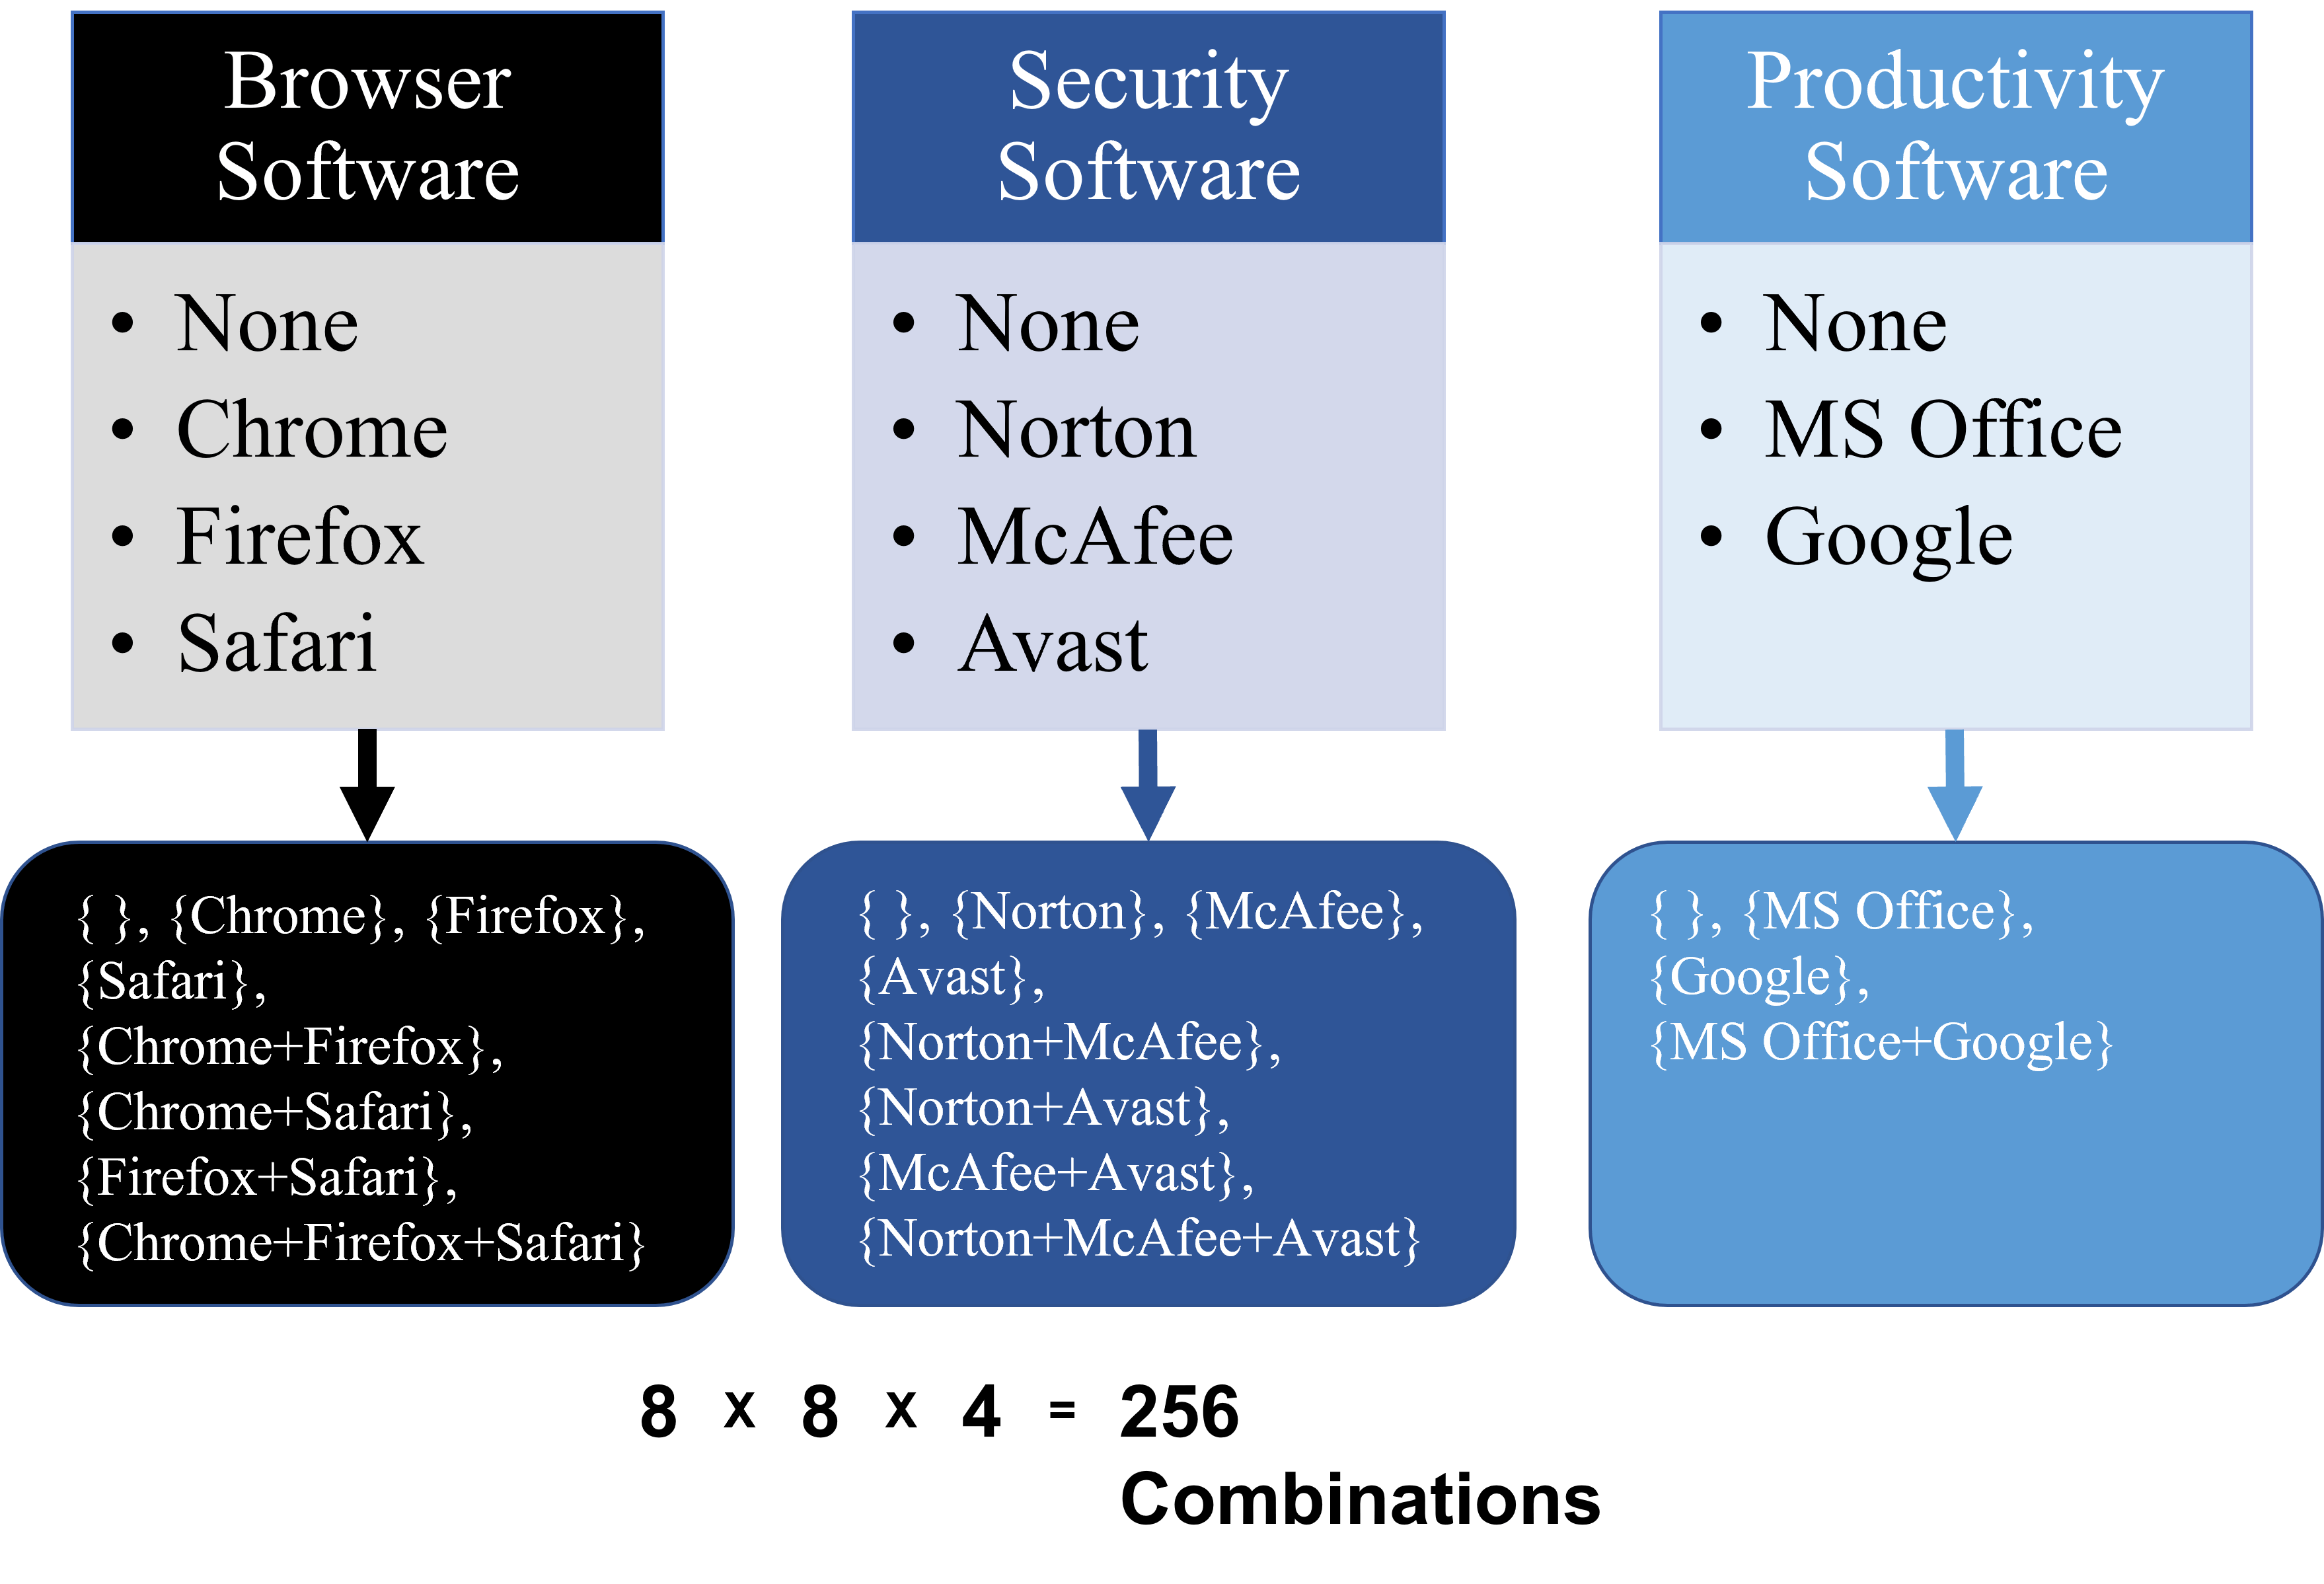
Figure 3. Example of a combinatoric situation common to cyber testing.
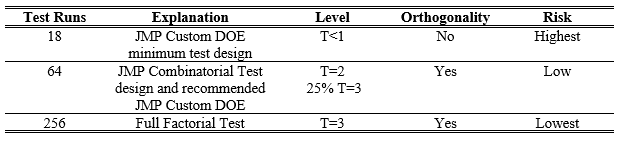
The full factorial test of 256 runs is generally too large for program budgets. Using combinatorial/design of experiments principles the lowest combinatorial test (guaranteeing T=2) lies at 64 runs and the minimum custom DOE test design using JMP software is 18 while the recommended DOE value is also 64 tests.
Using these four options (18, 64, and 256) any program can easily balance budget, schedule, and risk with a known level of test power.
Table 5. Test power review for combinatorial example.
Machine Learning for Cyber
After going through the cyber test process for multiple systems a cyber team should be able to generate enough training data and knowledge about the system to generate threat vectors using some level of machine learning. From a STAT point-of-view, machine learning would fill in the final gaps between the three other test processes, augmenting the test power and coverage metrics.
Generically cyber table top efforts and exploratory testing rely on the creativity of the human tester, while combinatorics effectively tackles the wide variety of system states. By extension then, AI should generate threats that were generally unknowable with the current level of human understanding (ref).
The AI test process might take on many forms in the future, but today the work would generally augment previous efforts. It either increases the coverage of a cyber table top effort or helps penetration test teams confirm threat vectors more efficiently. These actions will show up in the previously identified metrics.
For now, the research team recommends adding AI-identified items to the CTT list of threats. This will highlight the extent a cyber table top team using AI toolsets increases the percentage of threats identified and how that impacts CTT Power and CTT Coverage metrics.
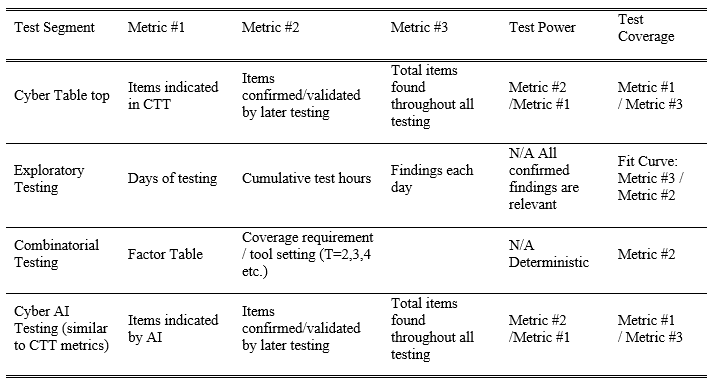
In the end, an evaluation of a cyber test program for test power and coverage might include the following analyses (Table 6).
Table 6. Overview of proposed cyber test coverage and power calculations.
Program Examples
Application of the metrics above has been profitable for multiple teams within Lockheed Martin.
Data collection for the proposed cyber table top metrics were not possible to confirm with past teams. These will be implemented in upcoming efforts and included in a future publication.
The number of findings per week from a major Defense system test is shown in Figure 4.
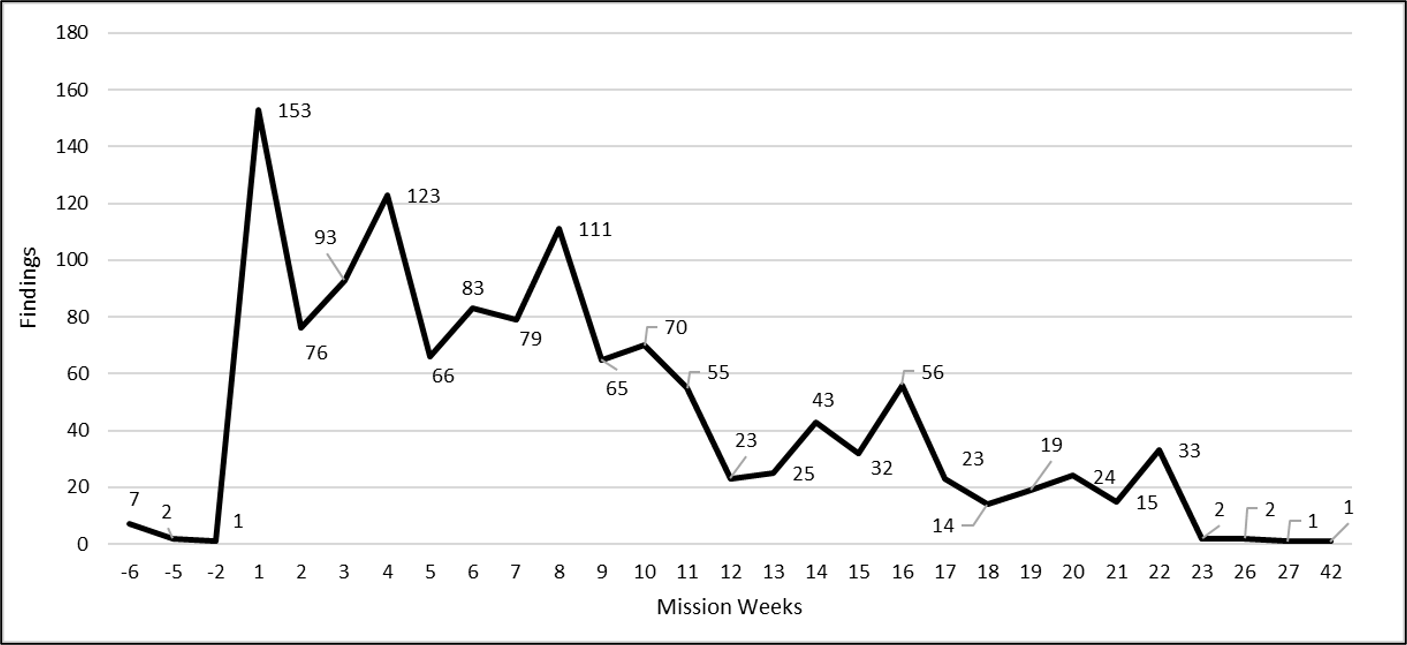
Figure 4. Trend of findings discovered weekly across formal testing engagements for a major defense program.
Figure 4 confirms the downward trend in penetration test findings. Negative weeks are “pre-execution” findings that were discovered during immersion, scoping, and passive recon testing. Week one, not surprisingly, held the highest overall number of discovered findings at 153. An interesting observation is the dip in week two and three but surges in week four and again in week eight.
Applying the proposed metric after the third surge (week 9) highlights the performance of the STAT metric for penetration testing.
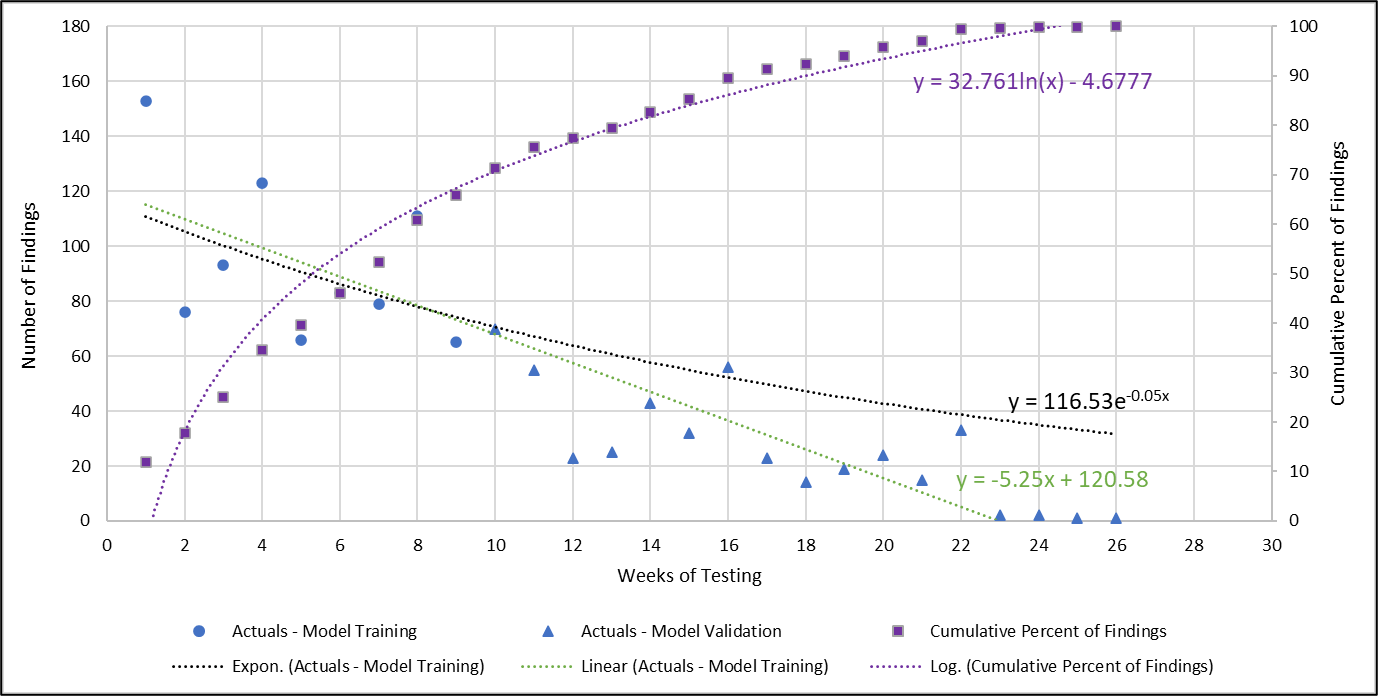
Figure 5. Penetration testing length prediction analysis for application of STAT (9th week prediction, exponential and linear trends shown). The first 9 weeks of findings are used to predict the performance of the test team over the next 15 weeks. Actual values are shown to validate the metric.
Using the exponential curve fit produces a conservative estimate of the predicted number of findings. However, the linear fit accurately predicts that the number of findings will zero out in week 23. Since generating the curves is simple, using both will generate a range of predictions with the linear version (green) crossing zero and the exponential curve (black) giving an alternative asymptotic option for consideration. Interestingly, the 80% finding threshold was at week 13, with 90% occurring at week 16 (out of 26), pointing out that the last 134 findings (10%) for this program cost ten times more than the first 134 findings.
Smaller programs can still use the basic method of tracking and charting findings and activity to help communicate the potential gains from additional testing.
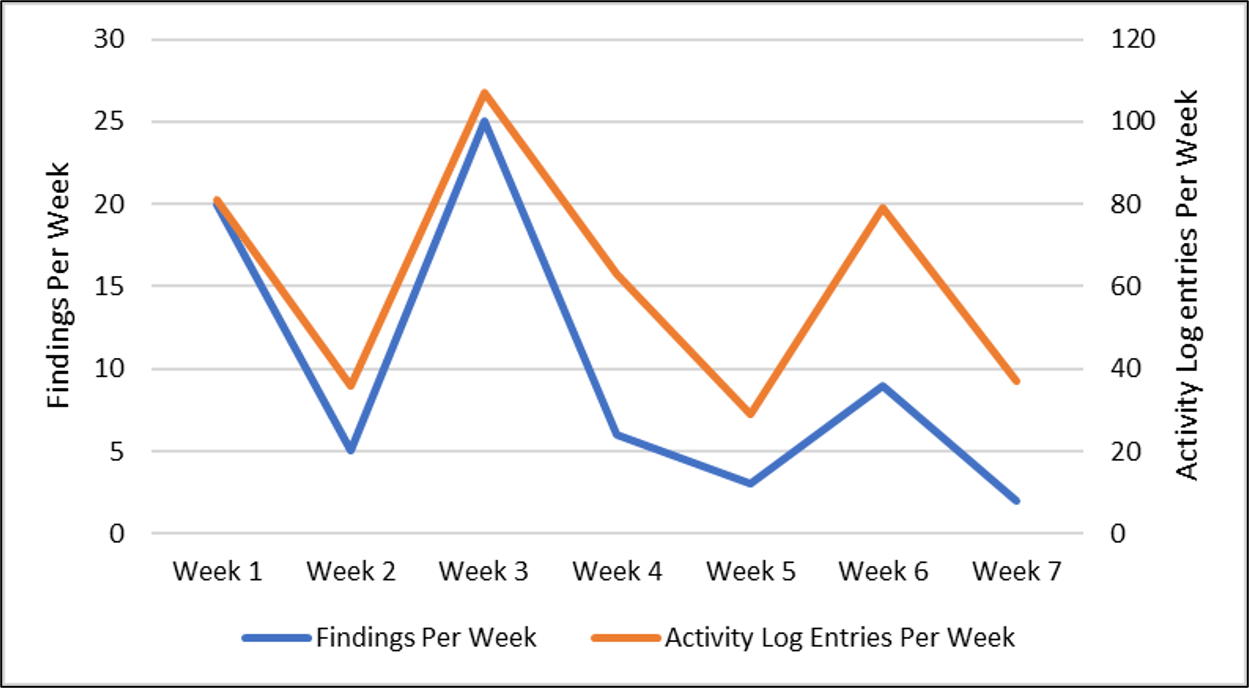
Figure 6. Trend of findings discovered weekly across formal testing engagements for a smaller defense program.
Smaller cyber test programs do not have enough training data to apply the recommended curves. However, the teams can benefit from taking the findings per week data and making a simple chart (Figure 6). Here are the team’s weekly notes from the effort:
- Week 1 was the mission start and you can see a surge of activity and findings – the project is new, exciting, fatigue is perhaps low etc.
- Week 2 was a partial-team week with some distractions.
- Week 3 was the first focused week for us, (we had the team focus entirely on the testing for this mission) and you see that high spike in findings and mission activity.
- Week 4 to end of week 5 was normal execution so a drop-off in activity.
- Week 6 was a second focused week for us, you can see the discovered findings is lower than week 3 focused week, but the activity is up there which tells me the team was trying to find vectors of attack.
- Week 7 sees the team dropping off. I would not expect future weeks to exceed the last few values.
Every test effort has a different story but the simple charting of findings and activity effectively tells the current state and provides a useful prediction of future performance.
Additional Findings from Program Data
While working on this paper the team found two additional trends in the data that can help test optimize test teams and predict the length of penetration test campaigns. The team has seen formal engagements with just a few machines, to tests approaching 900 machines so an analysis of scope versus test length was performed. For the team’s most recent 50 formal assessments, the average number of devices in scope for each test was 139. For the largest 8 formal assessments in the last two years (approximately the middle range of the overall data set), there was a correlation between scope size and mission length. Figure 6 below depicts the size of the testing scope compared to the duration of the mission in weeks.
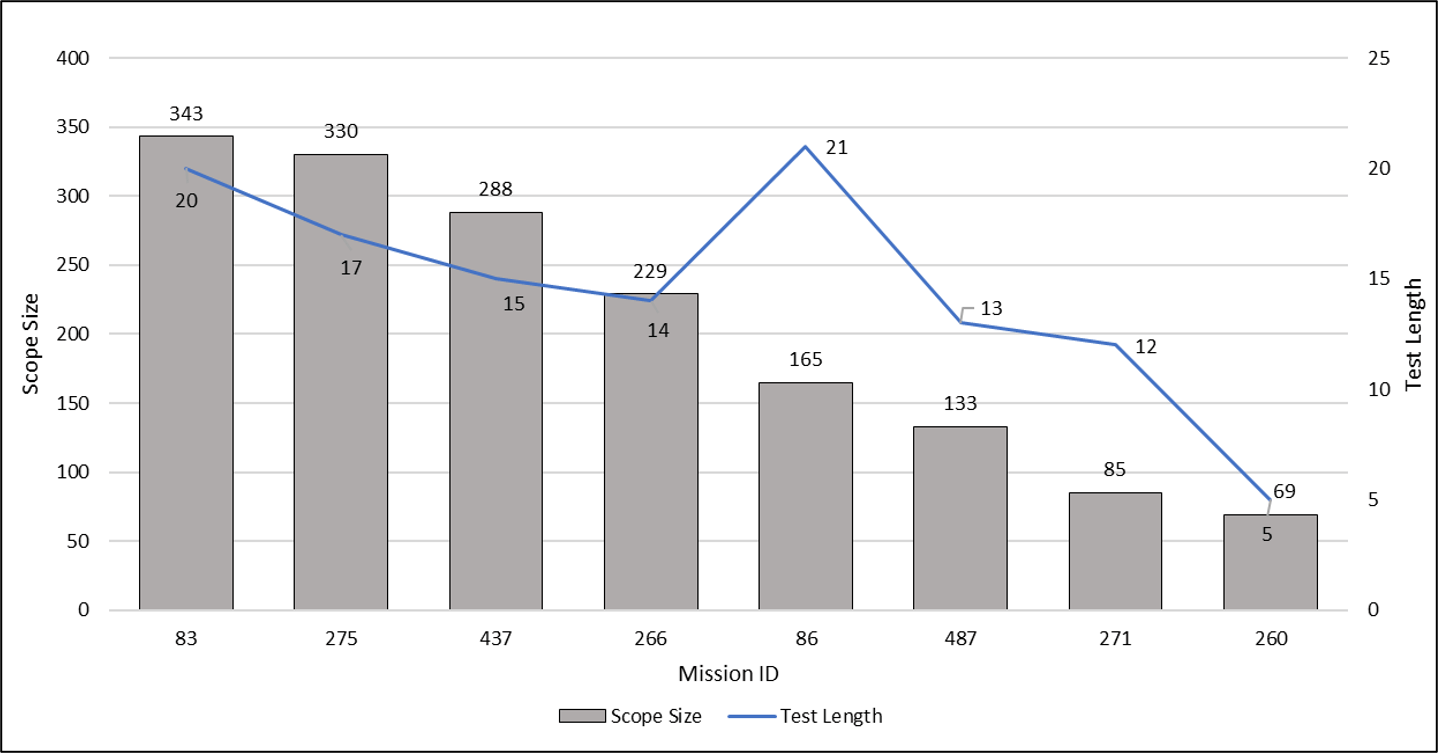
Figure 7. Data visualization for Cyber Test scope size and mission length from multiple defense programs.
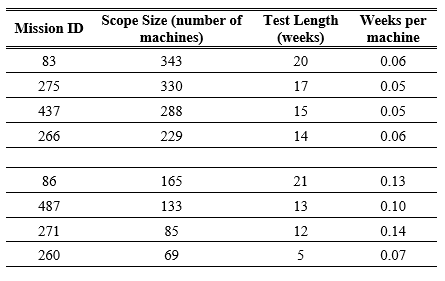
Table 7. Generation of rule-of-thumb ratios for cyber test program using data from multiple defense programs.
For missions larger than 200 machines the length of the testing is predicted by a ratio of 0.06 weeks per machine. For missions smaller than 200 machines, the length of testing is predicted by the ratio of 0.12 weeks per machine with smaller test missions having a wider range of ratios.
Resource Allocation
Larger scale engagements with a small number of testers can require a test to go longer than expected. On average, the team’s formal cyber tests had just under 13 members per engagement in the last two years. However, there can be diminishing returns on the number of findings generated for each member added to a test.
An analysis of test resources versus mission length and number of findings was performed for efforts with 3 to 20 test engineers. The data is shown in Figure 8.
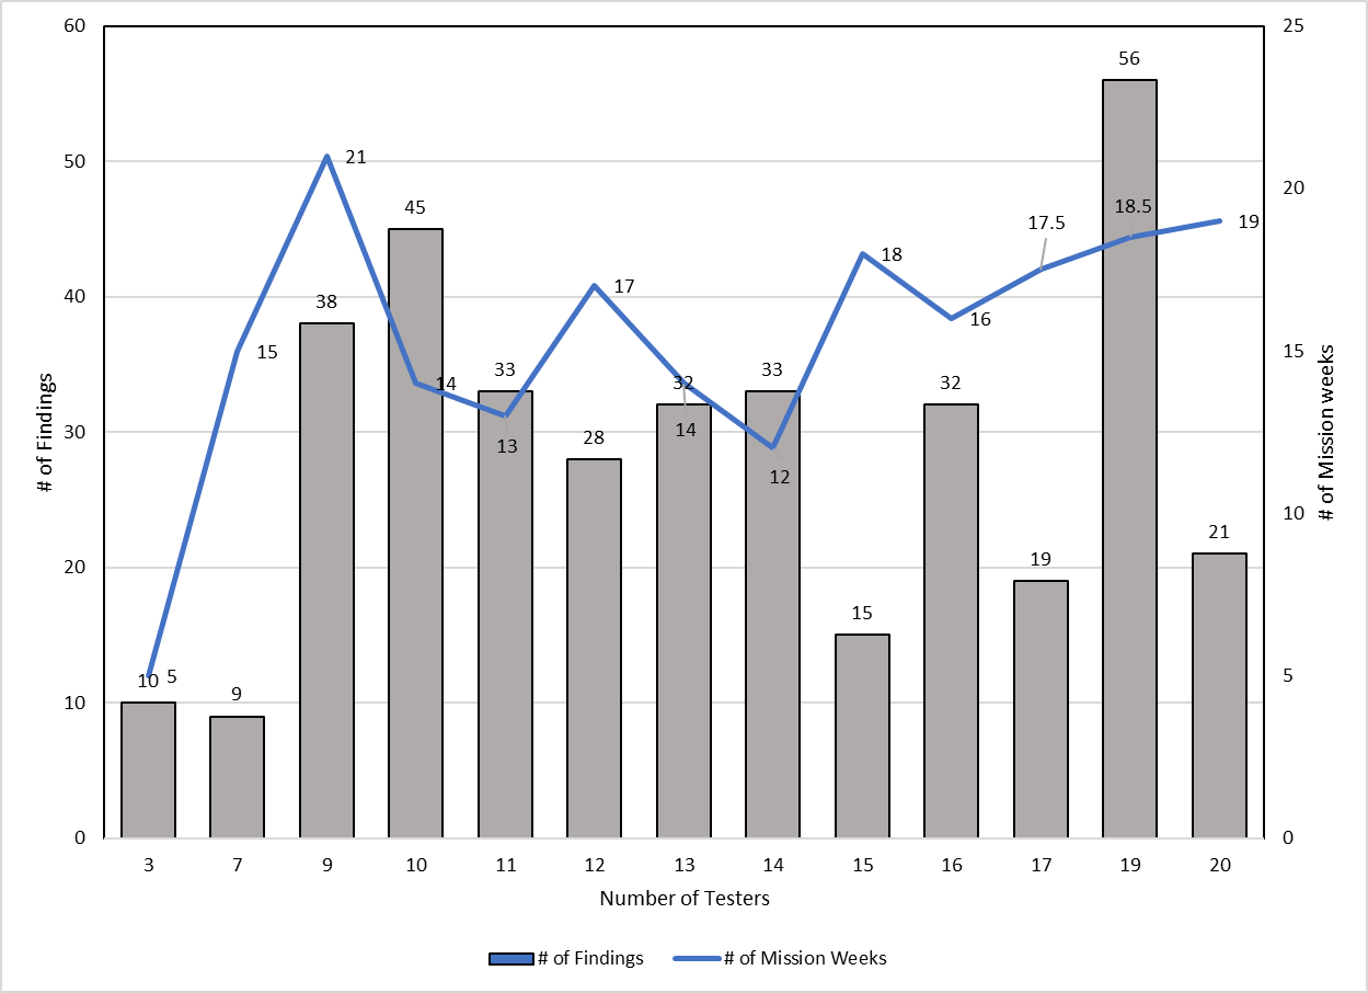
Figure 8. Visualization of data collected for test team size analysis.
Statistically, there are no trends in this data set. A multivariate analysis indicates that a correlation exists between Number of Testers and the number of Mission Weeks (Pearson, p=0.0223) but there is also no correlation between the other variables. This result leads towards the need for an additional factor of project size and/or complexity (see below) instead of a clear answer on Test Team sizing.
Inferentially, the data shows that 9 testers is a big jump in findings from 7, and the number of findings is similar or drops with larger group size and Missions from 12 to 18 weeks in length. The team thus recommends that a sweet spot exists for test teams between 9 and 14 testers.
Early Objective Completion
Cyber testing is not always over budget and behind schedule. The team has seen times when a test was completed much earlier than expected. This occurs in two situations:
- The system is found to be so hardened and secure that nothing is penetrating
- The vectors the team planned to explore were easier to test than expected
The savings is not infinite. So, as an additional rule-of-thumb, the earliest a team finished, in our experience, was two weeks ahead of schedule.
Scheduling Priority
Within the cyber world, the threat is ever-changing and constant. Based on intelligence received and potential direct attacks being observed against the enterprise, leadership may ask the cyber test team to re-prioritize an active mission.
This re-direction pauses the effort so the team can re-focus on a higher-priority mission (from a different program or system). While this pause can last several weeks, it could cause a test to end, especially if a new threat is persistent and priority dictates additional cycles be expended. At the least, it will take time for the team to return to the original test plan once the interruption is completed.
In other cases, the new threat greatly extends the current test effort as the team works to characterize, model, and address the new threat. Going into a penetration test cycle with a good list of vectors from a cyber table top allows a high level of pre-planning and organization, while learning ‘on-the-fly’ takes additional resources.
Conclusion
Multiple strategies for tracking cyber test team performance and predicting cyber test length were explored. These values align with STAT principles of test coverage and power giving test teams the ability to clearly communicate test risk and costs with customers and management.
The current data was also used to provide rule-of-thumb values for the estimation of test mission length by the number of machines and to optimize test teams towards groups of 9 to 14 people.
The team will continue to take data from ongoing Defense projects to further confirm and develop these statistical methods.
References
National Public Radio. (2021). Washington, D.C. https://www.npr.org/2021/04/16/985439655/a-worst-nightmare-cyberattack-the-untold-story-of-the-solarwinds-hack (accessed May 2024).Zhang, H., Wang, J., Wang, Y., Li, M., Song, J., & Liu, Z. (2024). ICVTest: A Practical Black-Box Penetration Testing Framework for Evaluating Cybersecurity of Intelligent Connected Vehicles. Applied Sciences, 14(1), 204. https://doi.org/10.3390/app14010204.
Luo, F., Zhang, X., Yang, Z., Jiang, Y., Wang, J., Wu, M., & Feng, W. (2022). Cybersecurity Testing for Automotive Domain: A Survey. Sensors (Basel, Switzerland), 22(23), 9211-. https://doi.org/10.3390/s22239211
Kim, I., Park, M., Lee, H. J., Jang, J., Lee, S., & Shin, D. (2024). A Study on the Multi-Cyber Range Application of Mission-Based Cybersecurity Testing and Evaluation in Association with the Risk Management Framework. Information (Basel), 15(1), 18. https://doi.org/10.3390/info15010018
Beyer, D., Nance, M., Lardieri, P., Roberts, N., Hale, R., Plummer, T., Johnson II, J. (2020). Lockheed Martin Cyber Resiliency Level® (CRL®) Framework V3.01 for Weapon, Mission, and Training Systems. https://www.lockheedmartin.com/crl (accessed May 2024).
Hankins, Michael, Johnson, Jason (2020). Lockheed Martin Cyber Resiliency Scoreboard® (CRS®). https://www.lockheedmartin.com/crs. (accessed May 2024).
Caron, F. (2021). Obtaining reasonable assurance on cyber resilience. Managerial Auditing Journal, 36(2), 193–217. https://doi.org/10.1108/MAJ-11-2017-1690.
[8] DoD. (2023). DoD Cybersecurity Test and Evaluation Guidebook Version 2 Change 1 https://www.dau.edu/sites/default/files/2023-09/Cybersecurity-Test-and-Evaluation-Guidebook-Version2-change-1.pdf
[9] DoD. (2020) DoD 5000.89, “Test and Evaluation,” November 19, 2020 https://www.esd.whs.mil/Portals/54/Documents/DD/issuances/dodi/500089p.PDF
[10] ITEA. (2016). Table Top Wargaming. Journal of Test and Evaluation. September 2016 volume 37. International Test and Evaluation Association.
[12] IBM Red Teaming (2023) ( https://www.ibm.com/blog/red-teaming-101-what-is-red-teaming/
[13] NIST. (2020). NIST Penetration Testing. https://csrc.nist.gov/glossary/term/penetration_testing
[14] Yamada, Akisa, Eberhart, Clovis, Ishikawa, Fuyuki, Lee, Nian-Ze (2019). Scenario Sampling for Cyber Physical Systems using Combinatorial Testing. IEEE International Conference on SoftwareTEsting, Verification, and Validation Workshops. p198-199.
[15] Kuhn, Rick, Kacker, Raghu, Feldman, Larry, White, Greg (2016). Combinatorial Testing for Cybersecurity and Reliability. Information Technology Lboratory Bulletin. May 2016. Elizabeth A. Lennon, Editor.
[16] Koroniotis N; et al. (2021). A Deep Learning-based Penetration Testing Framework for Vulnerability Identification in Internet of Things Environments. in Proceedings – 2021 IEEE 20th International Conference on Trust, Security and Privacy in Computing and Communications, TrustCom 2021, pp. 887 – 894, http://dx.doi.org/10.1109/TrustCom53373.2021.00125
NIST. (2023). Combinatorial Testing. Gaithersburg, MD. National Institute of Standards and Technology. https://csrc.nist.gov/projects/automated-combinatorial-testing-for-software (accessed May 2024).
ANSI. (2010). Z540.3 Handbook. Requirements for the Measuring of Test Equipment. American National Standards Institute. Washington D.C.
Barker, Clay. (2024). Power and Sample Size Calculations in JMP. White Paper. SAS Institute, Cary, NC.
Mackertich, Neal, Kim, Mary, Kraus, Peter, Rogers, Tonya. (2018). Statistical Test Optimization for Cyber Test. In Proceedings 5th Cybersecurity Worshop from Requirements to Test & Evaluation. International Test and Evaluation Association. March 8, 2018. https://itea.org/conference-proceedings/5th-cybersecurity-workshop-from-requirements-to-test-evaluation-2018.
Department of Operational Test and Evaluation. (2018). Scientific Test and Analysis Techniques—Guidance 3.0. Washington, D.C. https://www.dote.osd.mil/Portals/97/docs/TEMPGuide/STAT_Guidance_3.0.pdf (accessed May 2024).
McLean, Timothy. (2018) “Cyber Penetration Testing and Statistical Analysis in DT&E.” DATAworks Conference Archives. April 2018. https://testscience.org/dataworks-sessions-archive/?session=&archiveYear=2018.
Freeman, Laura. Institute for Defense Analyses. (2014). Scientific Test and Analysis Techniques: Statistical Measures of Merit. Alexandria, VA. https://www.ida.org/~/media/Corporate/Files/Publications/IDA_Documents/OED/2014/D-5070.pdf (accessed May 2024)
J. Itkonen, M. V. Mantyla and C. Lassenius. (2009). How do testers do it? An exploratory study on manual testing practices. 2009 3rd International Symposium on Empirical Software Engineering and Measurement, Lake Buena Vista, FL, USA, 2009, pp. 494-497. doi: 10.1109/ESEM.2009.5314240.
Itkonen, J., Mäntylä, M.V. (2014) Are test cases needed? Replicated comparison between exploratory and test-case-based software testing. Empirical Software Eng 19, 303–342 (2014). https://doi.org/10.1007/s10664-013-9266-8
Giovanni Apruzzese, et al. (2023). The Role of Machine Learning in Cybersecurity. Digital Threats 4, 1, Article 8 (March 2023), 38 pages. https://doi.org/10.1145/3545574
Bach, James. (2003). “Exploratory Testing Explained” University of Northern Iowa. 2003 https://www.cs.uni.edu/~wallingf/teaching/172/resources/exploratory-testing.pdf
Author Biographies
Patrick Lardieri is a Senior Fellow at Lockheed Martin Rotary and Mission Systems specializing in cyber test and evaluation, cyber risk assessment, and cyber resiliency of DoD systems. He has a Bachelor of Science in Electrical Engineering and a Bachelor of Arts in Mathematics from Rutgers University and a Master of Science in Electrical Engineering from University of Pennsylvania. He is a co-creator of the DoD Cyber table top process.
David Harrison is an Associate Fellow at Lockheed Martin Space specializing in the application of Scientific Test and Analysis Techniques (STAT) and uncertainty quantification to engineering and business problems. He has a Bachelor of Science in Mechanical Engineering from Kansas State University, a Master of Science in Materials Science from the Colorado School of Mines, and a Master of Engineering in Engineering Management from the University of Colorado at Boulder. He is also a Certified Test and Evaluation Professional and a Lean/Six-Sigma Master Black Belt.
Sharif Hassan is the Director of Intelligence Readiness & Response (LM-CIRT & LM Red Team and is the founding member of the Lockheed Martin Red Team. Sharif’s leadership has strengthened cyber defenses by uncovering numerous vectors of attack, ultimately reducing the risk posture for diverse advanced technologies, enterprise ecosystems, and national security weapon systems including DoD platforms such as the F-35. Sharif received both his Ph.D. in Computer Science and a B.S. in Management Information Systems at UCF and holds an M.S. in Computer Science from the Florida Institute of Technology.
Michael Hankins is a Lockheed Martin Fellow specializing in space cybersecurity, cyber risk assessment, and integration of cybersecurity into business capture processes. He has 19 years of experience as a cyber architect, cyber intel analyst, information assurance engineer, system administrator, and circuit board assembler and tester. He has a Bachelor of Science in Computer Science from the University of Colorado-Colorado Springs.
Govindra Ganesh (Roy) is the chief of testing and exploitation and an Associate Fellow on the Lockheed Martin Red Team with 18+ years of experience executing penetration testing and leading teams performing cyber testing. His work led to creating a framework which helps Red Teams contextually rate security findings from testing. He has a Bachelor of Science in Information Systems Technology from the University of Central Florida and a Master of Science in Computer Information Systems from Florida Tech.