September 2023 I Volume 44, Issue 3
I-TREE: A Tool for Characterizing Research Using Taxonomies
September 2023
Volume 44 I Issue 3
IN THIS JOURNAL:
- Issue at a Glance
- Chairman’s Message
Conversations with Experts
- Interview with Robert J. Arnold
Technical Articles
- I-TREE A Tool for Characterizing Research Using Taxonomies
- Scientific Measurement of Situation Awareness in Operational Testing
- Using ChangePoint Detection and AI to classify fuel pressure states in Aerial Refueling
- Post-hoc Uncertainty Quantification of Deep Learning Models Applied to Remote Sensing Image Scene Classification
- Development of Wald-Type and Score-Type Statistical Tests to Compare Live Test Data and Simulation Predictions
- Test and Evaluation of Systems with Embedded Machine Learning Components
- Experimental Design for Operational Utility
- Review of Surrogate Strategies and Regularization with Application to High-Speed Flows
- Estimating Sparsely and Irregularly Observed Multivariate Functional Data
- Statistical Methods Development Work for M and S Validation
News
- Association News
- Chapter News
- Corporate Member News
I-TREE: A Tool for Characterizing Research Using Taxonomies

Ms.Aayushi Verma
Data Science Fellow at the Institute for Defense Analyses
![]()
![]()
Abstract
The Institute for Defense Analyses (IDA) is developing a data strategy that implements data governance, data management, and data architecture practices and infrastructures. The data strategy leverages data to build trusted insights and establishes a data-centric culture. One component of the data strategy is a set of research taxonomies that describe and characterize research at IDA.
We have created a dataset that consumes disparate data sources related to these taxonomies and unites them with metadata about research products and projects to create quantified analytics addressing questions about research at IDA. This dataset is curated and ingested by an interactive Shiny web application using R, which has been named I-TREE (IDA-Taxonomical Research Expertise Explorer). In this paper, I explain how we used data science to create I-TREE, which aids IDA in collecting new insights and making informed decisions.
Keywords: Data science; data management; data strategy; taxonomies; research
Introduction
The Institute for Defense Analyses (IDA) is a research institution answering challenging questions about U.S. national security and science policy for its sponsors and business. As data is a core component of its objective and rigorous analyses, IDA is developing a data strategy to establish a data-centric culture and to leverage data for efficiently responding to sponsor and business needs.
This strategy implements solid and sustainable infrastructures and practices to promote a data-first approach through multiple initiatives, such as making data accessible, creating common language around data, streamlining data flows, investing in data literacy, and improving and measuring the effects of these initiatives.
This article highlights one of the outcomes of IDA’s data strategy, I-TREE, and how it is leading to better insights for staff to make data-driven decisions using data science.
Data Curation
A key initiative of the data strategy has been the development of a set of research taxonomies. These taxonomies are an organized hierarchy of words that describe research at IDA across eight broad domains, derived from IDA’s four core competencies (see Fig. 1).
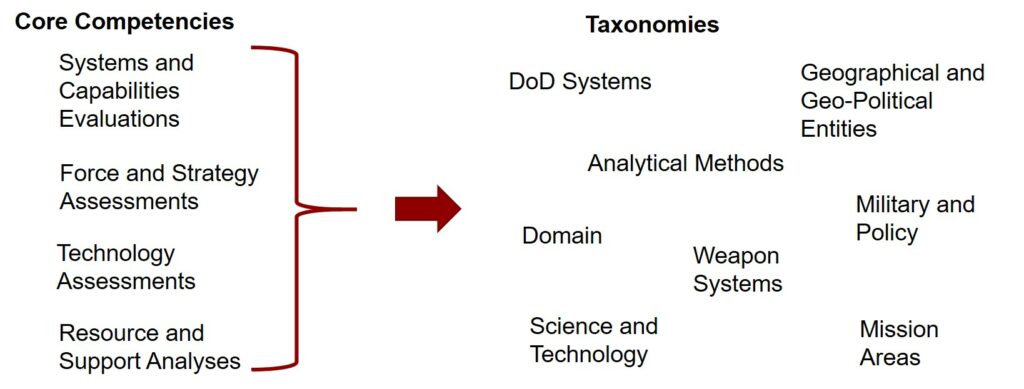 Fig. 1. Taxonomies Derived from IDA’s Four Core Competencies
The research divisions at IDA work on different sponsor and business projects and often produce deliverable products, such as reports or memorandums. These deliverable products have metadata associated with them, such as title of the product, associated project number, authors of the product, their associated research divisions, the project leader, and other related data.
These metadata can be combined with terms from the research taxonomies to provide more details about the product and its body of work. The product metadata and taxonomy term combination occurs through another initiative: a periodic tagging effort. During this periodic tagging effort, authors of products tag the products with relevant terms from the taxonomy that describe the body of work of the product. This creates a dataset of products, authors, and taxonomy terms, which we combine with other disparate data sources, such as product and project metadata and author and division data, to provide a cohesive and quantitative view of the research performed at IDA. In addition to curating this dataset, we produced a Shiny web application using R to display these data in a comprehensible format.
We used the programming language R (R Core Team 2022) and data science wrangling and cleaning techniques to create the dataset. We sourced the disparate data sources from different file formats and storage repositories. We wrote scripts to reproducibly combine these data sources to allow continued curation of this dataset as new data are created. These scripts used the tidyverse collection of packages (Wickham et al. 2019) and other packages like rsqlite (Müller et al. 2023) and ggplot2 (Wickham 2016). The application is a Shiny web application deployed on IDA’s internal servers and is available to IDA’s staff. In the next section, we describe the Shiny web application in more detail.
I-TREE Application
The Shiny web application is titled I-TREE, short for IDA-Taxonomical Research Expertise Explorer. It ingests the curated dataset, allows the user to filter data to answer specific questions, and displays a graph and a table of the filtered data. It is written using the R packages shiny (Chang et al. 2022) and shinyTree (Trestle Technology, LLC et al. 2019).
The application currently addresses five specific questions that IDA authors have about research expertise. There is one panel per question, with a set of filters one can use to answer a specific question. The display interface is structured with a filter pane on the left side of the screen and a display pane on the right side. The display pane consists of a bar graph display on the top and its accompanying data table on the bottom.
The first panel in the application answers the question “Who are the top authors for a research area?” (see Fig. 2). The research area is chosen from the taxonomy in the filters pane and can include the selected term and all terms below it (subtopics) in the hierarchy or the selected term by itself.
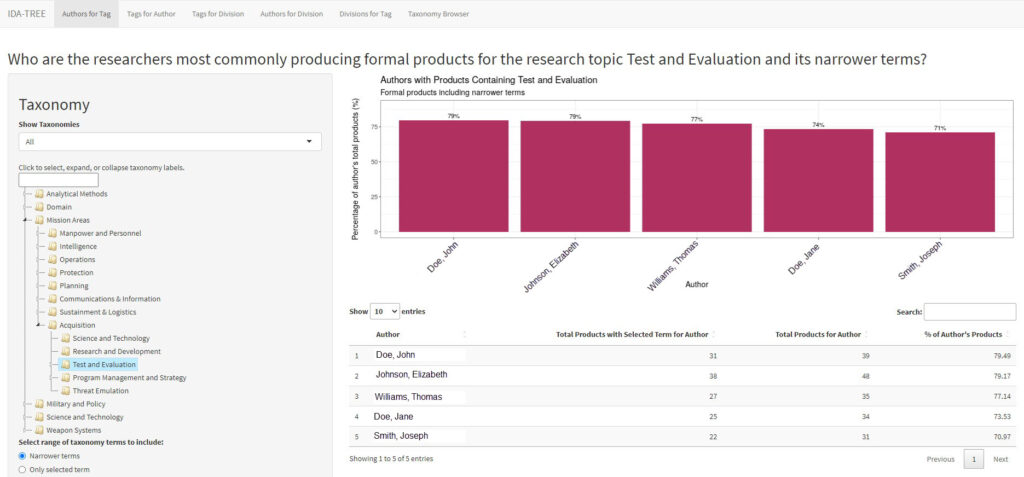 Fig. 2. First Panel of the I-TREE App Displaying the Top Authors Producing Products Tagged with “Test and Evaluation” and Its Related Terms *Note. IDA author names have been replaced with fictitious names.
Other filtering options include the year the product was published, research division that produced the product, level of formality of the product, active or inactive authors, minimum total number of products authors have tagged with a given term (i.e. all displayed authors must have published at least N products), and ranking by highest number of products produced or least number of products tagged. All these filters are available on the left pane of the application. The right pane displays a bar graph and a table depicting a ranked list of authors and the percentage of their products that are tagged with the selected taxonomy term.
The second panel answers the question “What is the research expertise of an author?” (see Fig. 3). This panel categorizes a selected author’s expertise based on the tags associated with their products. Choosing an author from the list of all published IDA authors filters the dataset to only include products the selected author produced. The filtering options in the left pane allow the user to select taxonomy terms and display the total number of an author’s products tagged with each taxonomy term or an aggregated number of taxonomy terms tagged for their products, similar to the first panel.
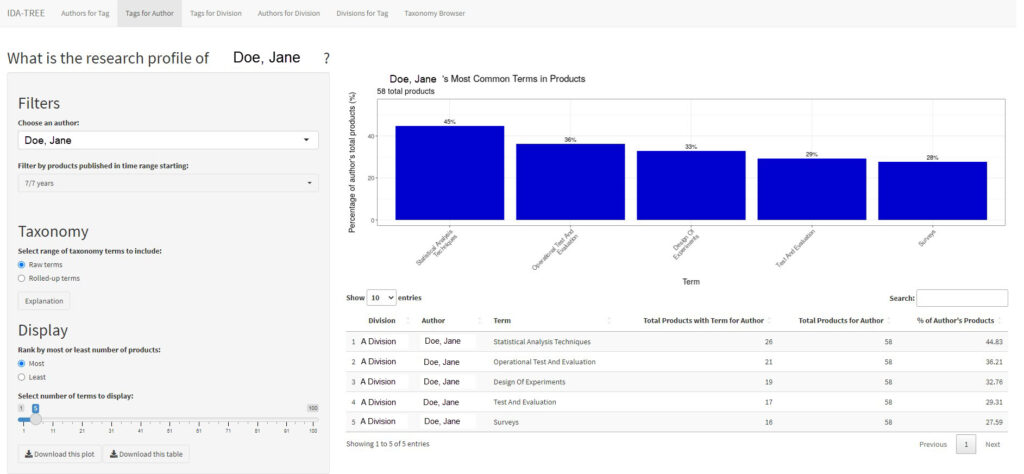 Fig. 3. Second Panel of I-TREE App Displaying the Top Five Areas of Expertise for a Selected Author (Jane Doe) Based on Taxonomy Terms Associated with Their Products *Note. IDA author names have been replaced with fictitious names.
The second panel includes filters for the year the product was published and for ranking by most products produced or least products tagged. The right pane displays a bar graph and table depicting a ranked list of the selected author’s taxonomy terms associated with their products and the percentage of their total products that are tagged with the respective term.
The third panel answers the question “What research does a division produce?” (see Fig. 4). This panel is very similar to the second panel, except that the user selects one of nine IDA research divisions to obtain a categorization of that division’s research expertise in terms of products produced by the division with their associated tagged terms. The filtering options are the same as the second panel, and the bar graph and table depict a ranked list of the selected division’s taxonomy terms associated with its products, as well as the percentage of their total products that are tagged with the respective term.
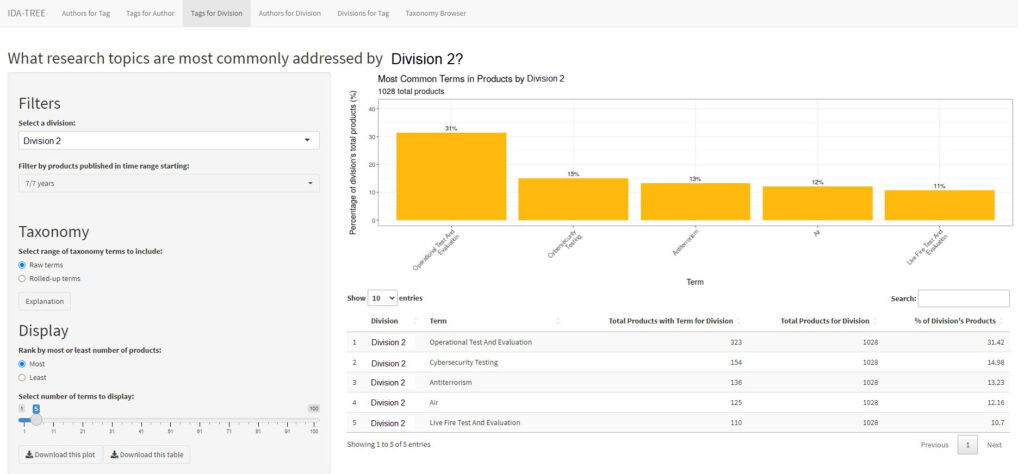 Fig. 4. Third Panel of the I-TREE App Displaying Division 2’s Top Areas of Expertise *Note. IDA division names have been replaced with fictitious names.
The fourth panel answers the question “Which authors have published the most products for a specific division?” (see Fig. 5). Similar to the third panel, the user selects a research division and obtains a breakdown of authors and their number of products published for that division. The filtering options are similar to the third panel, and the bar graph and table depict a ranked list of authors and the percentage of the selected division’s products they produced.
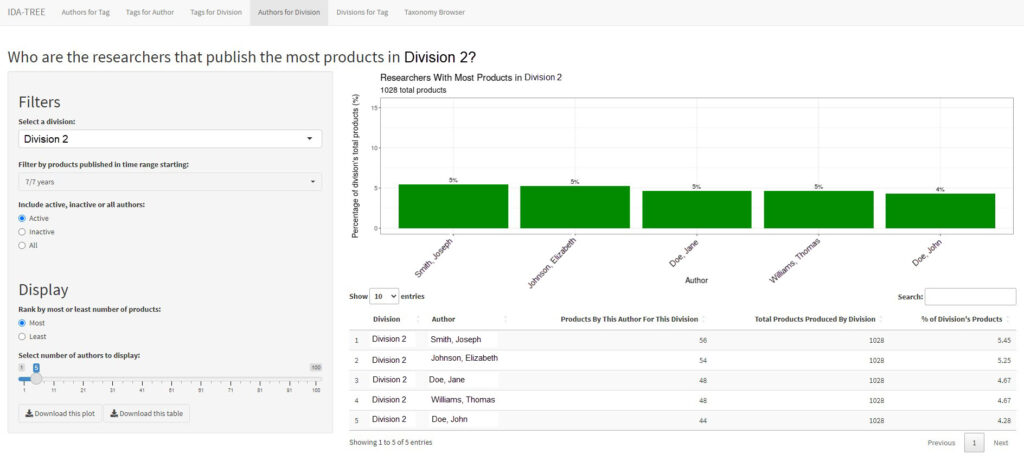 Fig. 5. Fourth Panel of the I-TREE App Listing the Authors Who Have Produced the Most Products in Division 2 *Note. IDA author and division names have been replaced with fictitious names.
Finally, the fifth panel answers the question “Which divisions publish the most products related to a chosen term?” (see Fig. 6). Similar to the first panel, the user selects a term from the taxonomy, and the bar graphic and table display a ranked list of divisions and the percentage of their products tagged with the selected term. The filtering options are also similar to the first panel.
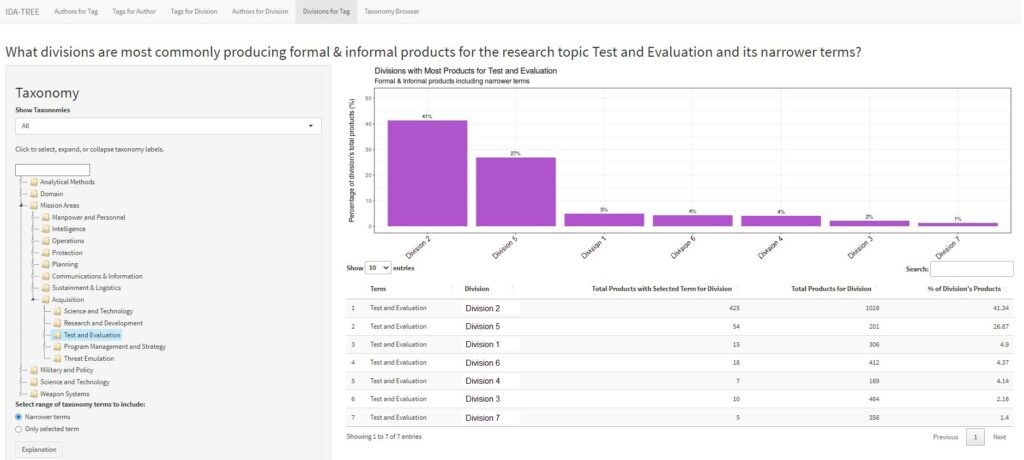 Fig. 6. Fifth Panel of the I-TREE App Ranking Each research division on the Number of Products It Has Produced Linked to the Topic “Test and Evaluation” *Note. IDA division names have been replaced with fictitious names.
IDA launched I-TREE in January 2023, and authors are already using it for novel purposes, such as finding subject matter experts across divisions, making inter-divisional contacts, building teams with specific skillsets, and more.
I-TREE is a step toward better quantifying the research performed at IDA. In the future, we will integrate more data sources into I-TREE, allowing researchers to answer more specific questions about the research performed at IDA. I-TREE is a demonstration of how data science is used to provide new views of pre-existing data in an interactive and flexible manner.
Conclusion
I-TREE demonstrates the use of data science with data management, data governance, and data architecture practices and infrastructures to enhance the company’s data strategy, enabling researchers and management to make better informed decisions. It will continue to be a valuable resource for researchers and management as new data streams are integrated to extract and deliver more insights to staff. It is an example of how corporate data can be wrangled and displayed to obtain novel views of data to benefit the business and sponsors.
Acknowledgements
Many thanks to Heather Wojton, Matthew Avery, and Laura Baldwin from the Institute for Defense Analyses for their support of this project and to Justace Clutter, William Doane, Jacklyn Kambic, and Keyla Pagan-Rivera from the Institute for Defense Analyses for their technical review of this project.
References
Chang, Winston et al. 2022. “shiny: Web Application Framework for R”. CRAN, R package version 1.7.4. https://CRAN.R-project.org/package=shiny.
Müller, Kirill et al. 2023. “RSQLite: SQLite Interface for R.” R package version 2.2.16. https://CRAN.R-project.org/package=RSQLite.
R Core Team. 2022. R: A Language and Environment for Statistical Computing. R Foundation for Statistical Computing, Vienna, Austria. https://www.R-project.org/.
Trestle Technology, LLC et al. 2019. “shinyTree: jsTree Bindings for Shiny.” R package version 0.2.7. https://CRAN.R-project.org/package=shinyTree.
Wickham, Hadley. 2016. ggplot2: Elegant Graphics for Data Analysis. New York: Springer-Verlag.
Wickham, Hadley et al. 2019. “Welcome to the Tidyverse.” Journal of Open Source Software, 4, no. 43, 1686. doi:10.21105/joss.01686.
Author Biography
Aayushi Verma is a Data Science Fellow at the Institute for Defense Analyses. She supports the Chief Data Officer and the IDA Data Initiative Strategy by leveraging disparate sources of data to create applications and dashboards for IDA staff. Her data science interests include data analysis, machine learning, artificial intelligence, and extracting stories from data. She has a B.Sc. (Hons.) in Astrophysics from the University of Canterbury and is currently pursuing her M.S. in Data Science from Pace University.